Overview
A real-time cryptocurrency price tracking and anomaly detection system that monitors multiple exchanges, flags unusual price movements, and sends alerts via web dashboard and notifications. Designed for traders, analysts, and developers who want to detect early signs of volatility or potential market manipulation.
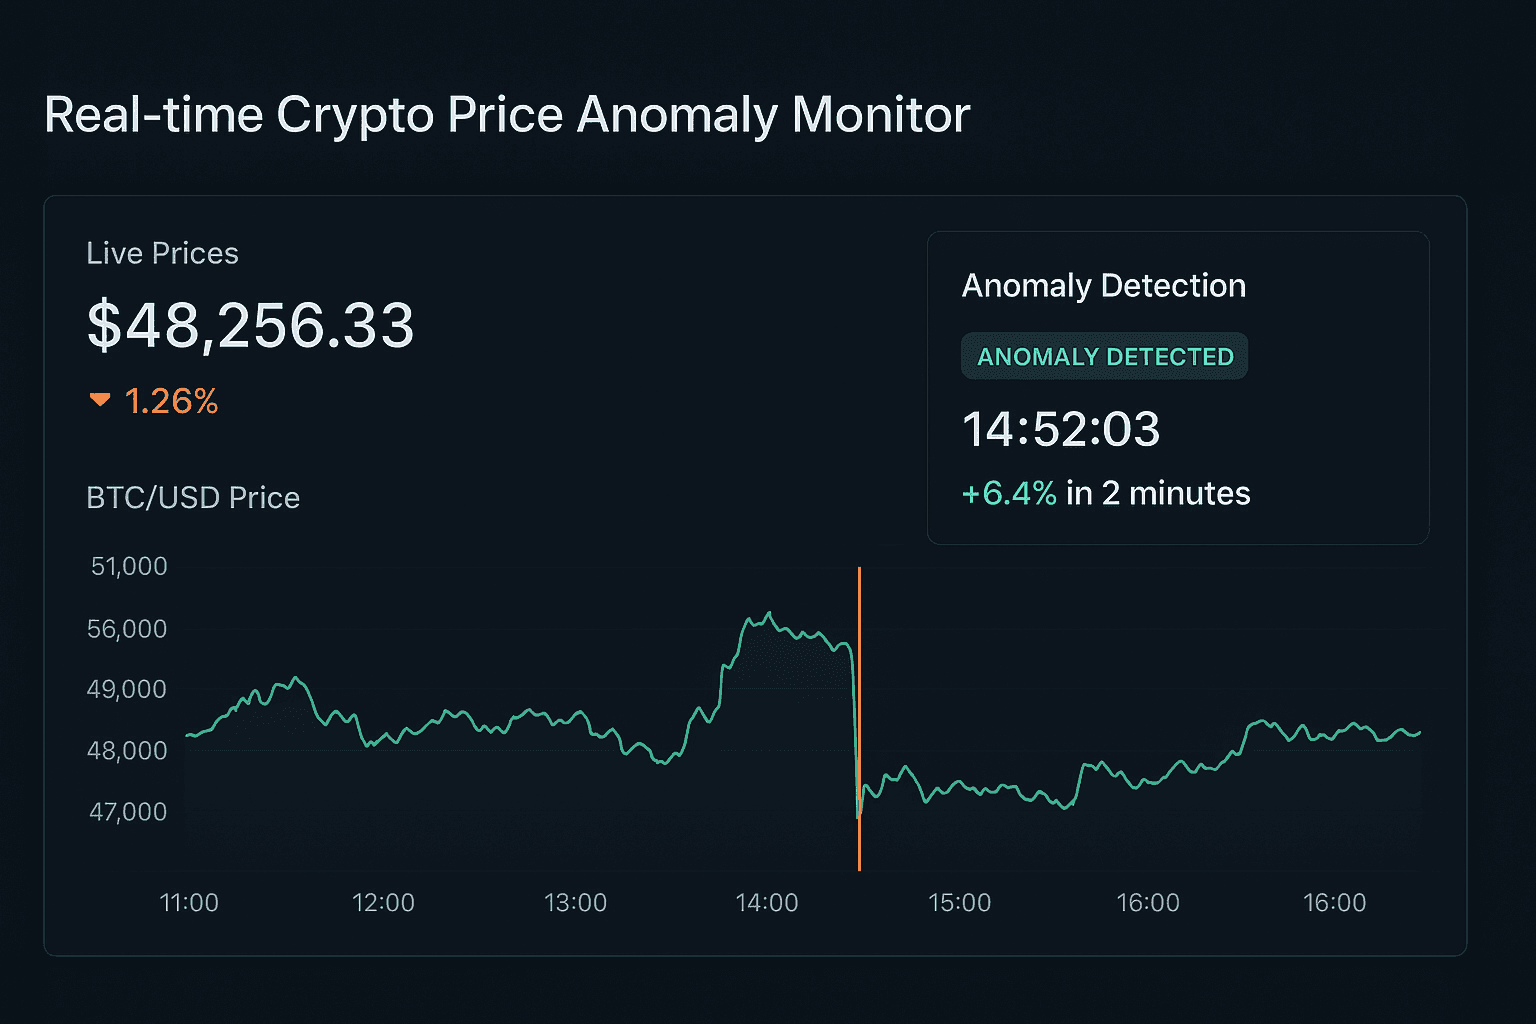
Key Features
Live Price Streaming – Fetches real-time data from major crypto exchanges via WebSocket & REST APIs.
Anomaly Detection – Detects sudden price spikes, dips, or unusual volatility using statistical and ML-based methods.
Multi-Exchange Support – Aggregates prices from multiple sources for accuracy and resilience.
Interactive Dashboard – Visualizes live prices and anomaly events in real-time charts.
Custom Alerts – Sends push/email notifications when anomalies are detected.
Scalable Architecture – Built with asynchronous processing to handle large volumes of tick data.
Architecture Snapshot
A[Crypto Exchanges] -->|Live Prices (WebSocket / REST)| B[Data Ingestion Service] → B --> C[Data Preprocessing & Cleaning] → C --> D[Anomaly Detection Engine] → D -->|Detected Anomalies| E[Notification Service] → D --> F[Backend API (FastAPI)] → F --> G[React Dashboard] → E -->|Email / Push / Webhooks| H[End Users] → G --> H
🧾 Tech Stack
Component | Technology Used |
|---|---|
Data Ingestion | Python, WebSocket, REST APIs |
Data Processing | Pandas, NumPy, AsyncIO |
Anomaly Detection | Scikit-learn, Statistical Models (Z-Score, IQR, Isolation Forest) |
Backend API | FastAPI |
Dashboard & Charts | React.js, Chart.js / D3.js |
Alerts & Notifications | Webhooks, SMTP, Push API |
Deployment | Docker, AWS (EC2 / Lambda / S3) |
📊 Anomaly Detection Methods
Statistical Thresholding: Z-Score
Interquartile Range (IQR)
Machine Learning: Isolation Forest, One-Class SVM
Rolling Window Volatility Analysis: Detects unusual standard deviation changes
